The Overlapping Valuation Thesis: Understanding the Nasdaq’s Structural Premium
Currently, the market is experiencing a persistent, low-volatility upward grind, with the Nasdaq noticeably outpacing both the S&P 500 and the Dow Jones. While mainstream analysis attributes this entirely to AI enthusiasm and earnings growth, looking closely at modern market plumbing reveals a structural mechanic at play: valuation overlap.
Due to a combination of regulatory reporting thresholds and modern index construction, the Nasdaq is experiencing a partial circularity in its valuation. Here is a breakdown of the mechanics driving this divergence, the algorithmic feedback loop amplifying it, and how we are positioning for it.
1. The Set Theory of Market Caps
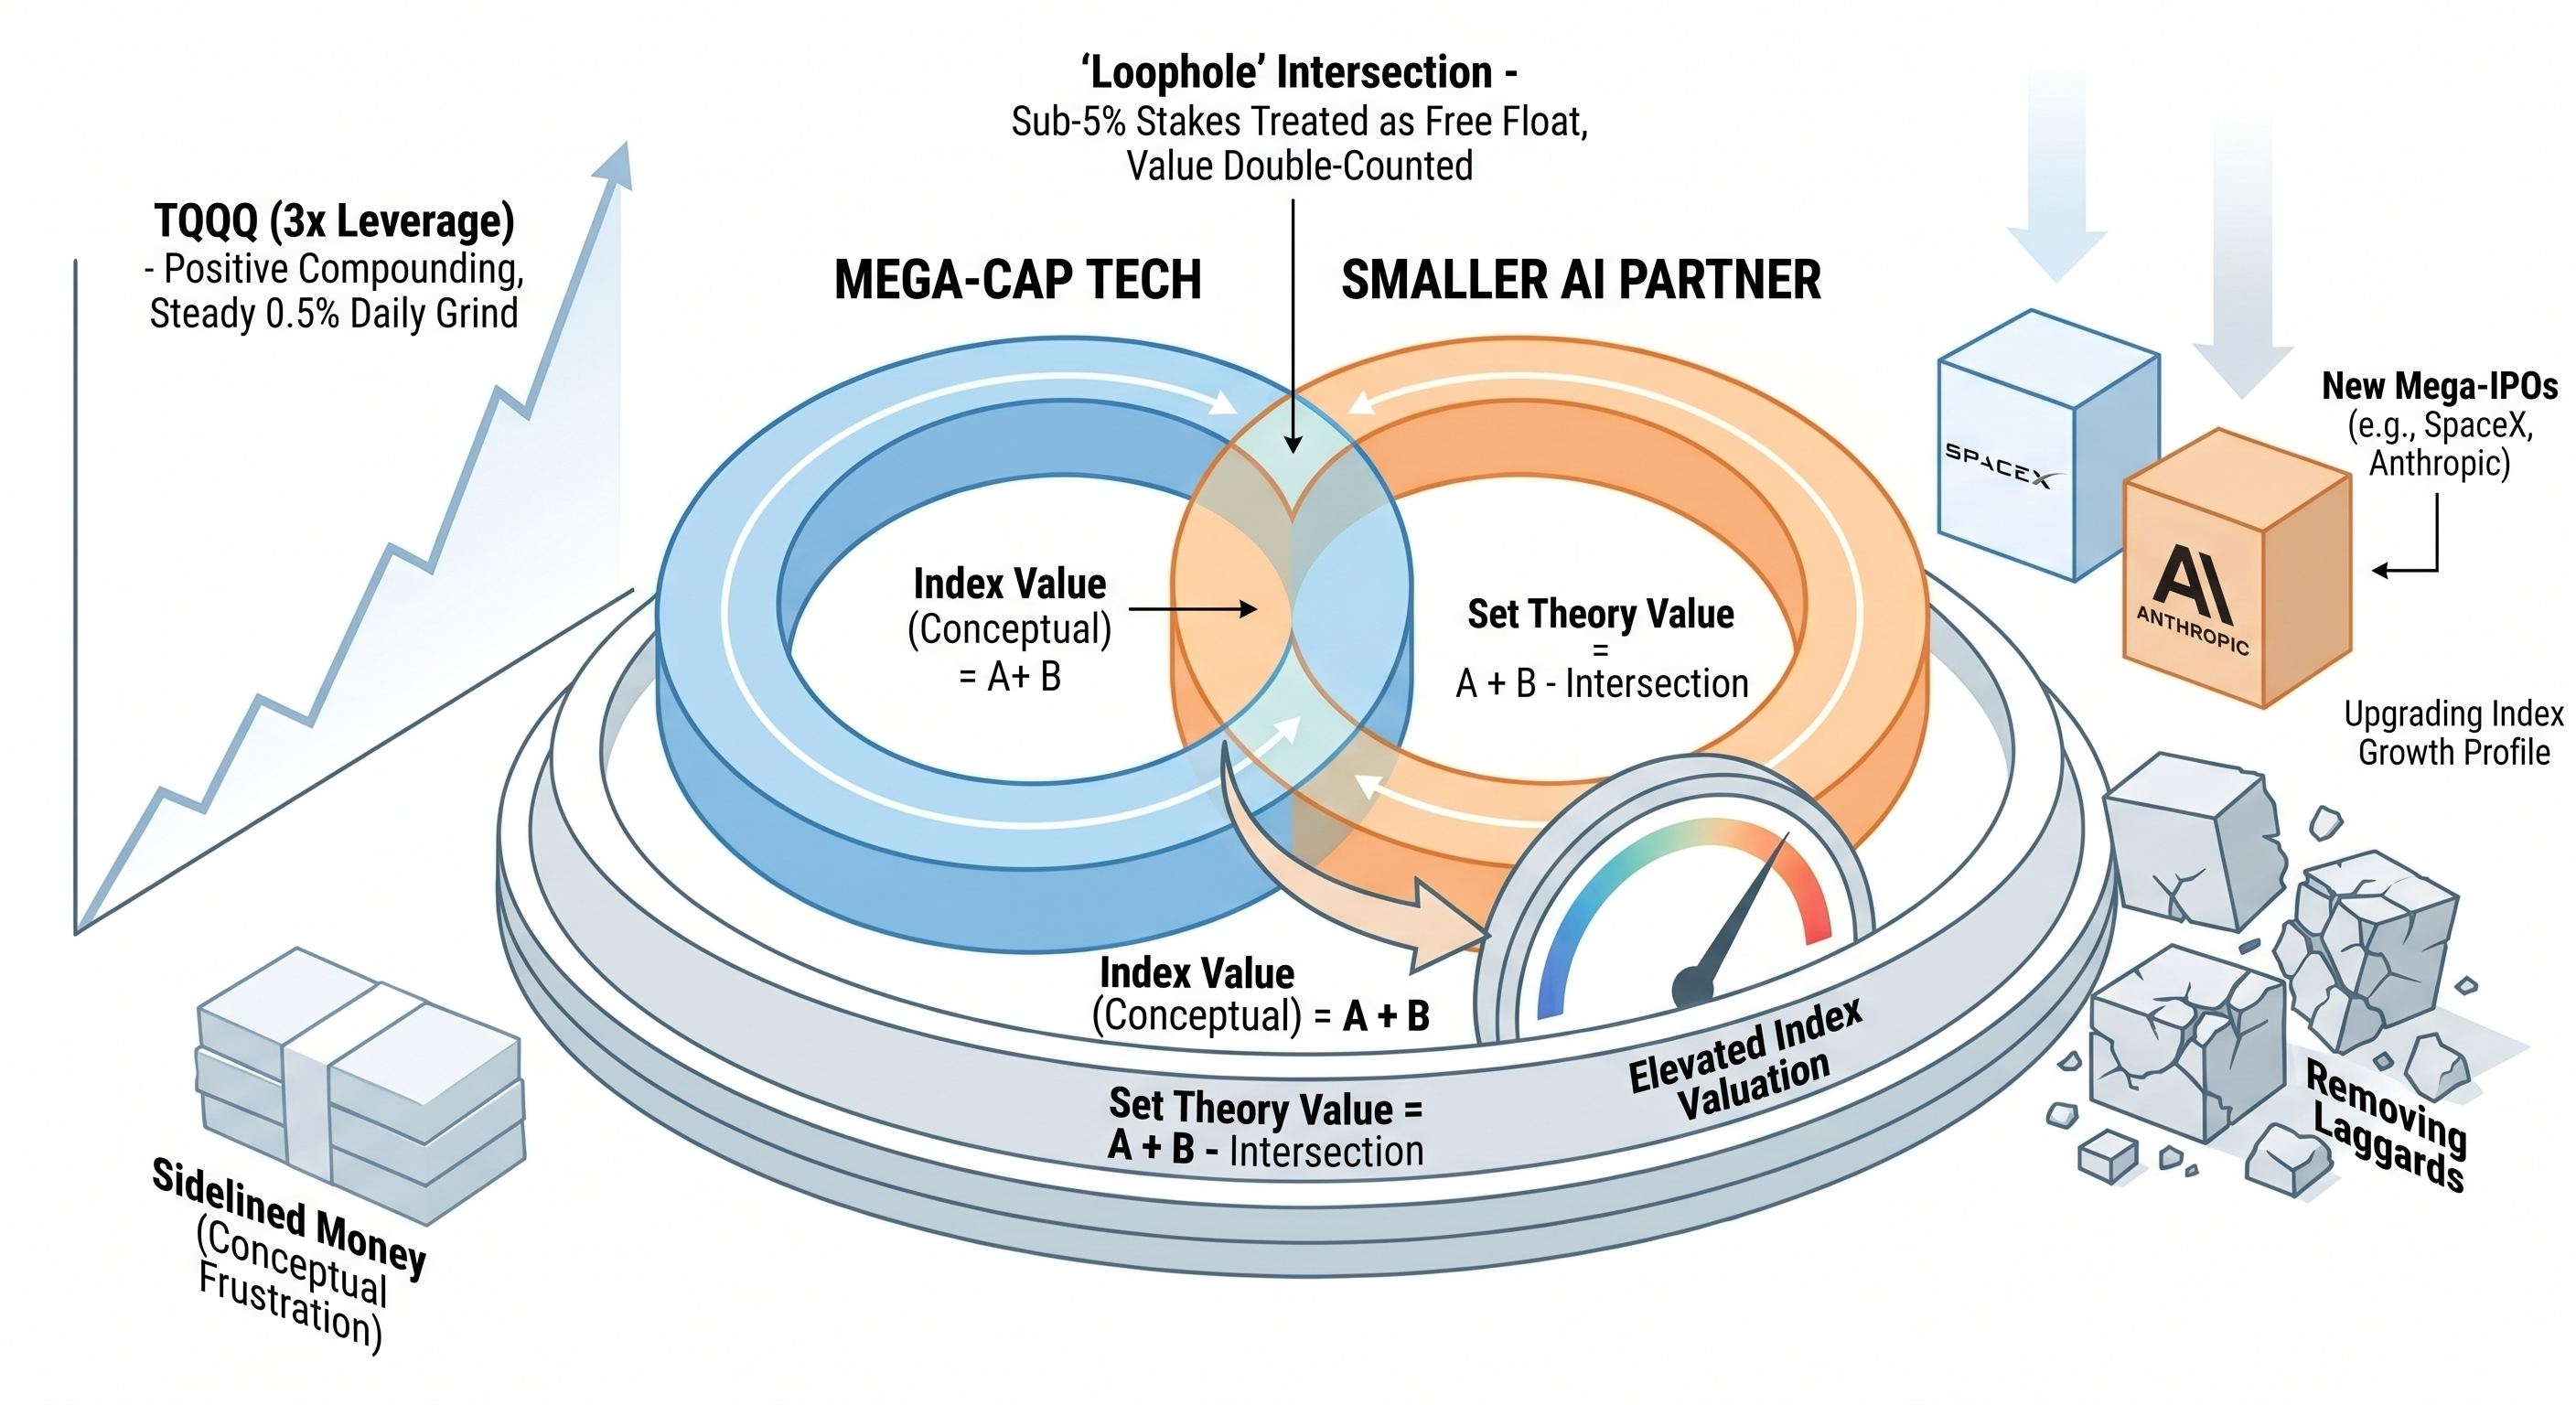
To understand index valuation, we can look at basic set theory. If you want to find the total value of Set A and Set B combined, and those sets overlap, the formula is:
$$A \cup B = A + B - (A \cap B)$$
The intersection must be subtracted to avoid double-counting.
In today’s tech ecosystem, mega-cap companies are actively cross-investing. They are securing supply chains and funding AI startups, acting essentially as corporate venture capital. When calculating the total weight of an index, the index providers should ideally subtract these overlapping corporate investments. However, due to regulatory blind spots, the intersection ($A \cap B$) is often left in the equation, creating a degree of valuation overlap.
2. The 5% Free Float Discrepancy
Index providers like Nasdaq use “Float-Adjusted” market caps to prevent double-counting locked-in shares. But they rely on SEC filings to determine what shares are locked.
- The 13D Rule: If a company acquires 5% or more of another public company, it triggers an immediate Form 13D filing. Index providers classify this as a non-free-float control block and successfully subtract those shares.
- The 13F Rule: If a company buys a stake under 5%, rapid disclosure isn’t required. It appears later on a delayed quarterly 13F. Because the stake is under 5%, index rules generally classify these shares as “Free Float.”
For example, Alphabet has held a public stake in ARM historically worth around $250 million. This is well under 1% of ARM. The index gives ARM full credit for those shares in its free-float weighting, while Alphabet’s stock price also reflects the asset on its balance sheet. While this individual stake is negligible in a $25 trillion index, this dynamic repeats across dozens of strategic supply chain and AI partnerships, creating a cumulative structural premium.
3. Algorithmic Sum-of-the-Parts (SOTP) Pricing
This partial circularity is amplified by modern quantitative trading. High-frequency algorithms constantly calculate Sum-of-the-Parts (SOTP) valuations for mega-caps, factoring in their minority stakes in real-time.
When a smaller tech company rallies, algorithms automatically bid up the shares of the mega-cap holding a strategic stake in it. Because the Nasdaq-100 is highly concentrated with companies cross-pollinating in the same cloud and semiconductor ecosystems, this creates an internal feedback loop. The effect isn’t a fundamental flaw, but rather a subtle premium in heavily concentrated ecosystems.
4. Market Psychology and Sidelined Cash
Beyond the structural mechanics, a behavioral driver is supporting the current low-volatility grind.
As of mid-May 2026, U.S. money market funds hold roughly $7.75 trillion. Many investors parked capital here waiting for a standard 5% to 10% correction to re-enter the tech sector. However, the steady 0.5% daily grind we are seeing prevents a clean entry point. This creates a “pain trade”—forcing underperforming capital to slowly capitulate and buy in at higher prices, providing a steady bid under the market.
5. The AI Basket Approach: Hedging the Unknown
Perhaps the most compelling reason to trade this dynamic via the index rather than individual stocks is the inherent uncertainty of the AI race. No one—not even the tech CEOs themselves—knows exactly which specific company, model, or hardware architecture will ultimately dominate the next decade.
However, we do know that the ultimate winners are almost certainly contained within this specific basket. Because the mega-caps are cross-investing to hedge their own single-company risk, owning the index allows us to piggyback on their venture strategy. We don’t have to pick the winning horse; by holding the Nasdaq-100, we own the entire racetrack. If a smaller partner wins, the mega-cap holding their shares wins, and the index captures the upside regardless.
6. Strategy: TQQQ and Macro Risks
We are currently utilizing TQQQ (the 3x leveraged Nasdaq ETF) to capture this structural upward bias.
In a steady, low-volatility uptrend, daily resetting leverage experiences minimal—or even positive—compounding compared to choppy markets. As long as the market avoids sharp, consecutive drawdowns, the leverage applies to a growing capital base.
The Macro Reality Check: This structural bias is an enhancer, not a perpetual motion machine. Path dependency and volatility spikes remain the primary risks to TQQQ. Furthermore, this entire ecosystem premium can reverse violently upon a macro shock—such as an unexpected rebound in inflation, a sudden spike in interest rates, or tech giants signaling a reduction in AI CapEx spending.
7. The Upcoming IPO Catalysts
We are watching the private market closely. Giants like SpaceX and Anthropic are reaching valuations that rival top public companies. Effective May 1, 2026, Nasdaq implemented new rules allowing top-40 ranked mega-IPOs (by market cap) to enter the index after roughly 15 trading days, complete with graduated float weighting.
When these companies inevitably go public, their inclusion offers a potential “upgrading” of the index via rebalancing, fundamentally bolstering the Nasdaq’s growth profile by replacing stagnant, lower-weighted companies with hyper-growth assets.
8. Exit Parameters
This is a calculated momentum and structural play. We are monitoring three specific indicators to signal an exit:
- Volatility Expansion: A shift from the methodical daily grind to larger, more erratic daily gap-ups (2% to 3%+), signaling late-stage FOMO buying.
- VIX Contraction: The VIX dropping from its current mid-teens range down toward the 10-12 level, indicating that institutional hedging has evaporated and market complacency has peaked.
- The IPO Event: The actual pricing and index inclusion of these mega-IPOs, which often serves as a liquidity event as early investors “sell the news.”
Until these parameters are met—or macro data fundamentally breaks the tech CapEx cycle—the structural and behavioral forces point toward continued, methodical upside.