Selectivity vs Volume: Why Selection is the Ultimate Force Multiplier
Selectivity vs Volume: Why Selection is the Ultimate Force Multiplier
In quantitative trading, the validity of a strategy is only as good as its constraints. At retailtrader.ai, we utilize an Exact Parity Simulator that treats our strategy with the same rigor as a professionally managed fund. Our latest results reveal a compelling narrative: algorithmic selection transforms raw market signals into institutional-grade alpha.
Context of Performance
- Out-of-Sample Data: These results represent live data tracked since our launch in Nov 2025, representing ~50 days. While the metrics are subject to short-term compounding due to the short time window, it demonstrates the general efficacy and the positive alpha of the methodology used.
- Normalization: We fully expect these extraordinary figures to normalize as market conditions shift.
- Live Signals: This simulation shows how the system would have performed if you followed the actual live signals delivered to our users since our launch in the real-world environment.
1. Experimental Design: The “Physics” of the Forward-Simulation Test
Most retail systems generate massive mental stress by forcing users to chase nanosecond ticks. We reject that model in favor of First Principles. Our architecture is specifically tailored for a “Fire and Forget” approach:
- Momentum Horizon: We target multi-day momentum moves with holding periods of 20 days for longs and 2 days for shorts.
- Psychological De-risking: This allows everyday individuals to execute signals and walk away, removing the constant monitoring and psychological friction that usually leads to poor decision-making.
- Starting Liquidity: All tests assume a baseline of $250,000, a realistic baseline for a managed portfolio.
- Positive Convexity: We size trades based on a strict 0.5% Risk Per Trade rule. Your position size is mathematically determined by the distance to your stop-loss, ensuring a single bad trade never compromises the portfolio.
- Friction Modeling: We apply a 10 basis point (bps) slippage on both entry and exit (0.2% round-trip). This ensures our CAGR reflects realized profit after Slippage Drag.
2. Parameter Stability: The Robustness of the Ranking Process
A cornerstone of our research is Parameter Stability. In data science and quantitative modeling, an “unstable” strategy is one that relies on a single “perfect” setting—often a sign of over-fitting to historical noise. A truly robust strategy shows persistence across multiple tiers.
Our engine demonstrates remarkable stability from “The Sniper” through to “The Grind,” proving that our Energy Ranking logic is effective regardless of how many trades you choose to take.
Performance Comparison Summary
| Execution Tier | Capital Cap | Daily Limit | Avg. Trade ($) | Total CAGR | Sortino Ratio |
|---|---|---|---|---|---|
| Top 1: The Sniper | $60,000 | 1 | $463.72 | 100.28% | 6.37 |
| Top 2: High Conviction | $30,000 | 2 | $308.49 | 121.80% | 8.59 |
| Top 3: Balanced Growth | $20,000 | 3 | $329.30 | 208.90% | 14.25 |
| Top 4: Peak Efficiency | $16,600 | 4 | $354.37 | 282.98% | 12.83 |
| Top 5: Diversified | $10,000 | 5 | $118.86 | 117.77% | 11.48 |
| Unlimited: The Grind | $1,000 | 200+ | $5.55 | 15.08% | 6.54 |
3. Data Science Rigor: Outlier Resistance and Alpha Dilution
To further validate these results, we applied Outlier Sensitivity Testing. Even if we performed a “trimmed mean” analysis—removing the top 1% and bottom 1% of trades—the strategy would still perform at an extremely healthy rate. This confirms that our CAGR isn’t driven by a handful of “lucky” outliers, but by a consistent, repeatable edge.
The “Sweet Spot” (Tiers 3 & 4)
Tiers 3 and 4 represent the mathematical “sweet spot” of the strategy. Tier 3 achieved an extraordinary 14.25 Sortino Ratio, indicating that almost every unit of downward volatility was dwarfed by significant upward movement. Unlike the Sharpe Ratio, which penalizes all volatility, the Sortino Ratio specifically focuses on “harmful” downside risk.
Alpha Dilution & Selectivity
The “Unlimited” tier provides a vital baseline. In this model, the average trade value drops to just $5.55. This is a clear demonstration of Alpha Dilution—as you trade more “noise,” transaction friction eats the edge. This proves that Selectivity is a mathematical necessity.
4. Market Regime & Structural Hedging
Our system is designed for Dynamic Hedging, trading both longs and shorts simultaneously to provide a natural structural hedge.
- The Bull Market Headwind: In recent tests, short-side performance averaged around flat to slightly negative, which is expected in a secular bull market regime.
- Investor Optionality: Directional traders can choose to discard short signals to potentially achieve even higher returns, though this increases directional risk (higher Beta).
5. Interpreting Volatility: Risk-Adjusted Returns
To maintain full transparency, it is essential to address the risk profile behind these extraordinary returns. While the Max Drawdown figures are extremely low across all tiers (ranging from -0.44% to -1.58%), this is a reflection of the short time frame of the live-signal forward-test, not an inherent guarantee of future stability.
- Max Drawdown Context: The low drawdown figures confirm the strategy’s effectiveness at managing immediate losses when a signal is wrong, thanks to the strict 0.5% Risk Per Trade rule and tight stop-losses.
- Long-Term Ratios: The exceptionally high Sharpe and Sortino Ratios signify that the system generated significant returns with minimal harmful downside volatility. These ratios will likely decrease as the time horizon extends across multiple full market cycles.
6. Real-World Expectation Management
While the data supports a high level of confidence in the strategy’s edge, we urge users to temper expectations with the following realities:
- Short Window: We recognize results may appear “too good to be true.” Our intent is to demonstrate positive alpha, not permanent triple-digit returns.
- Slippage and Execution: Our model includes a conservative 0.2% round-trip slippage. Individual results vary based on broker and execution speed.
- The Short Side: Short signals served primarily as a hedge in this bull market. Their true value is protection during market corrections or bear regimes.
Detailed Performance Metrics by Execution Tier
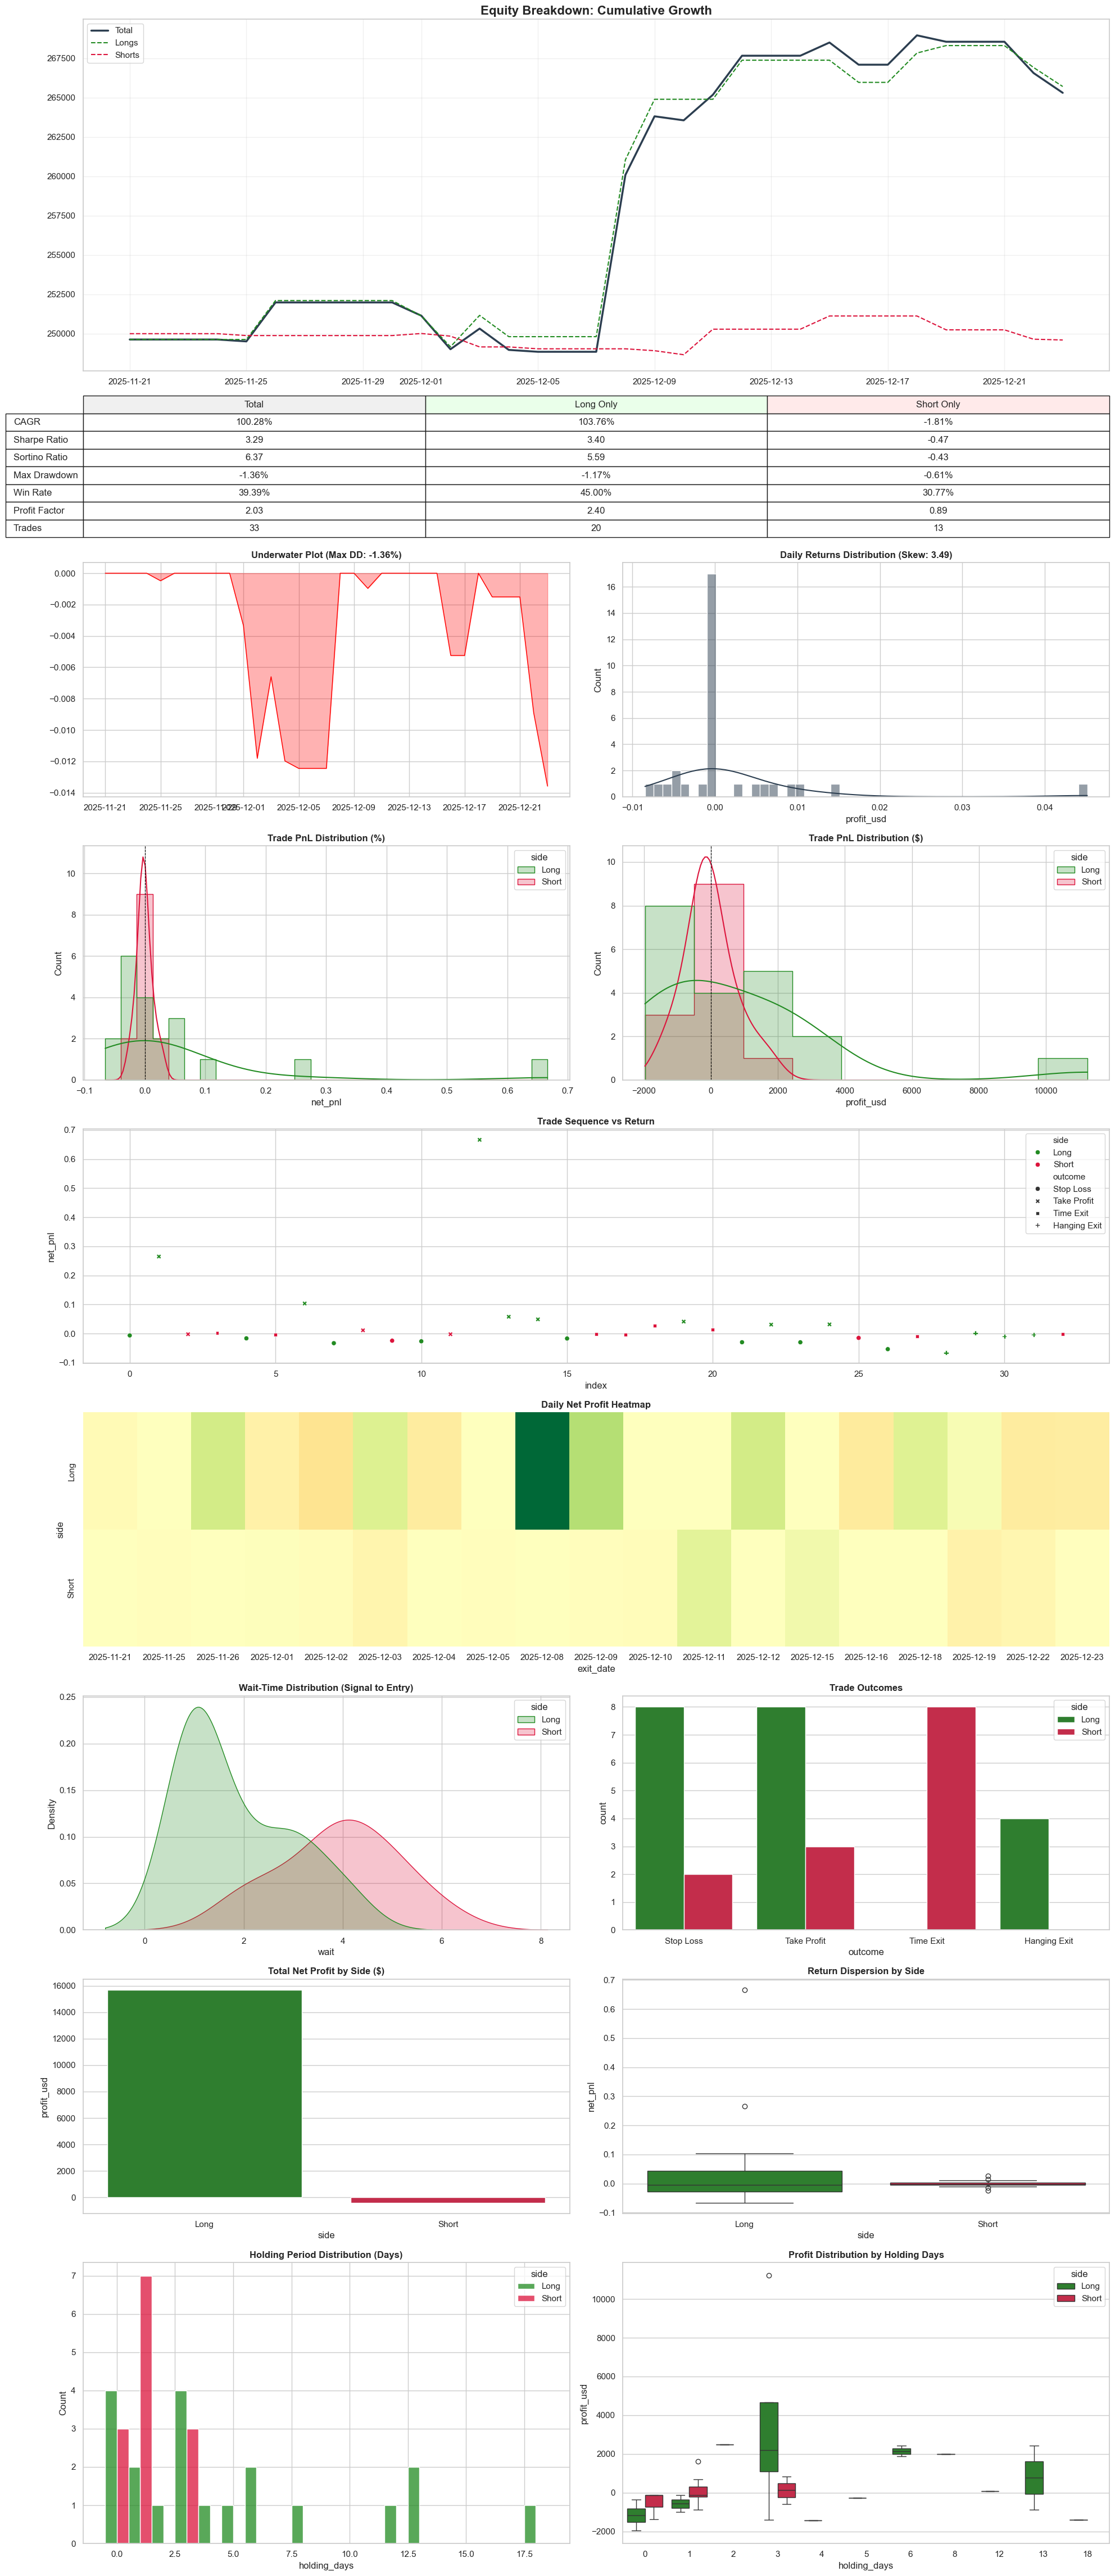
Tier 1: The Sniper ($60,000 Capital Cap)
| METRIC | TOTAL | LONG ONLY | SHORT ONLY |
|---|---|---|---|
| CAGR | 100.28% | 103.76% | -1.81% |
| Sharpe Ratio | 3.29 | 3.40 | -0.47 |
| Sortino Ratio | 6.37 | 5.59 | -0.43 |
| Max Drawdown | -1.36% | -1.17% | -0.61% |
| Total Return | 6.28% | 6.44% | -0.16% |
| Win Rate | 39.39% | 45.00% | 30.77% |
| Profit Factor | 2.03 | 2.40 | 0.89 |
| Avg Trade ($) | $463.72 | $785.17 | -$30.82 |
| Trades | 33 | 20 | 13 |
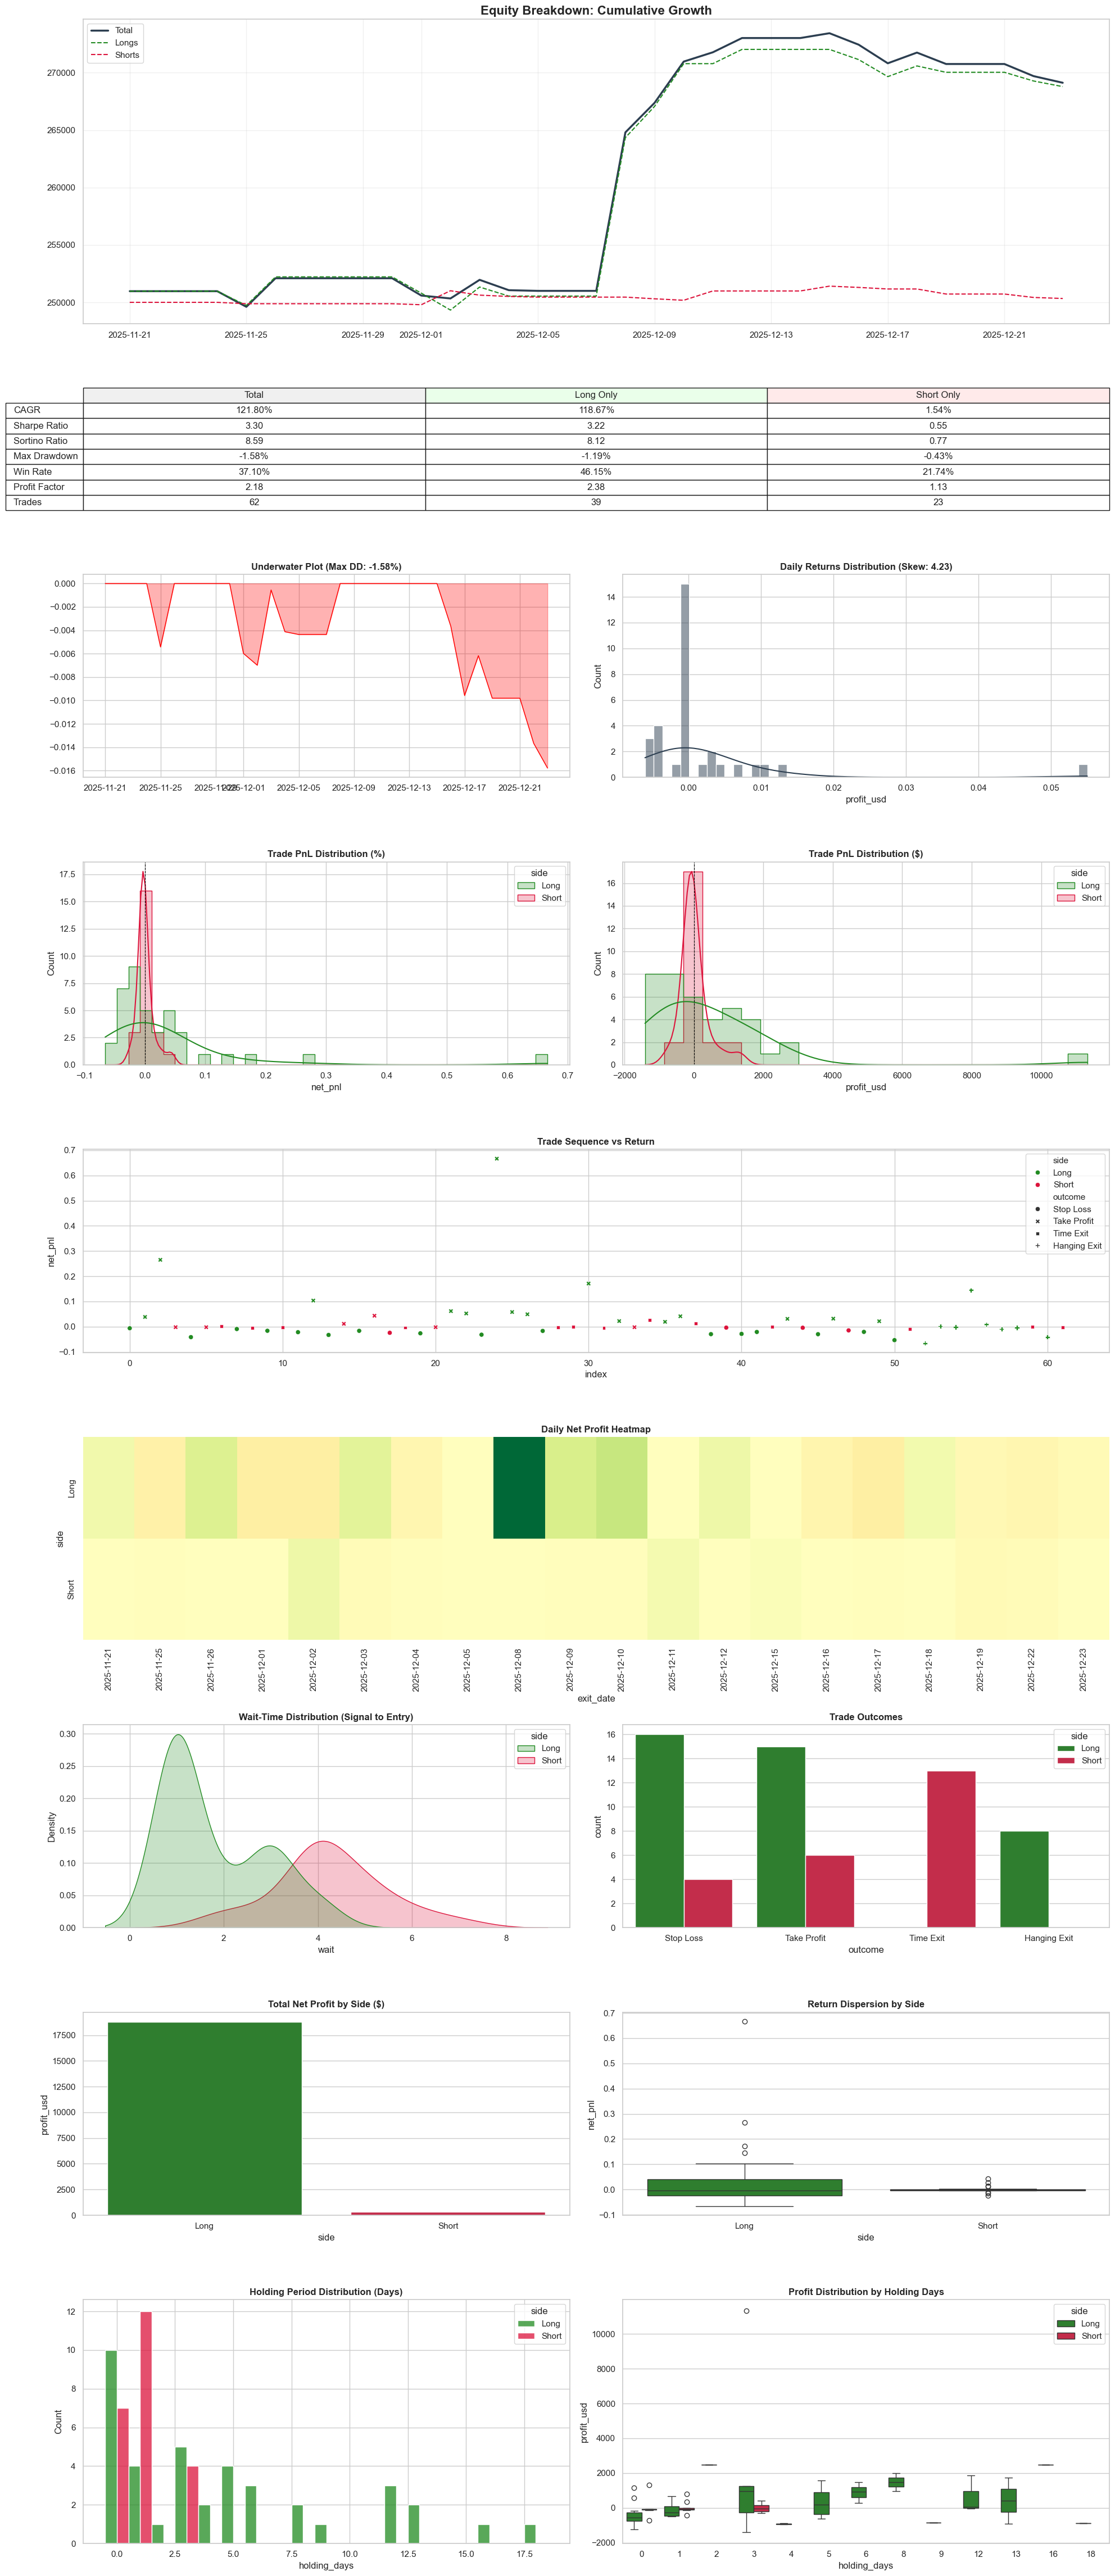
Tier 2: High Conviction ($30,000 Capital Cap)
| METRIC | TOTAL | LONG ONLY | SHORT ONLY |
|---|---|---|---|
| CAGR | 121.80% | 118.67% | 1.54% |
| Sharpe Ratio | 3.30 | 3.22 | 0.55 |
| Sortino Ratio | 8.59 | 8.12 | 0.77 |
| Max Drawdown | -1.58% | -1.19% | -0.43% |
| Total Return | 7.23% | 7.10% | 0.13% |
| Win Rate | 37.10% | 46.15% | 21.74% |
| Profit Factor | 2.18 | 2.38 | 1.13 |
| Avg Trade ($) | $308.49 | $481.83 | $14.57 |
| Trades | 62 | 39 | 23 |
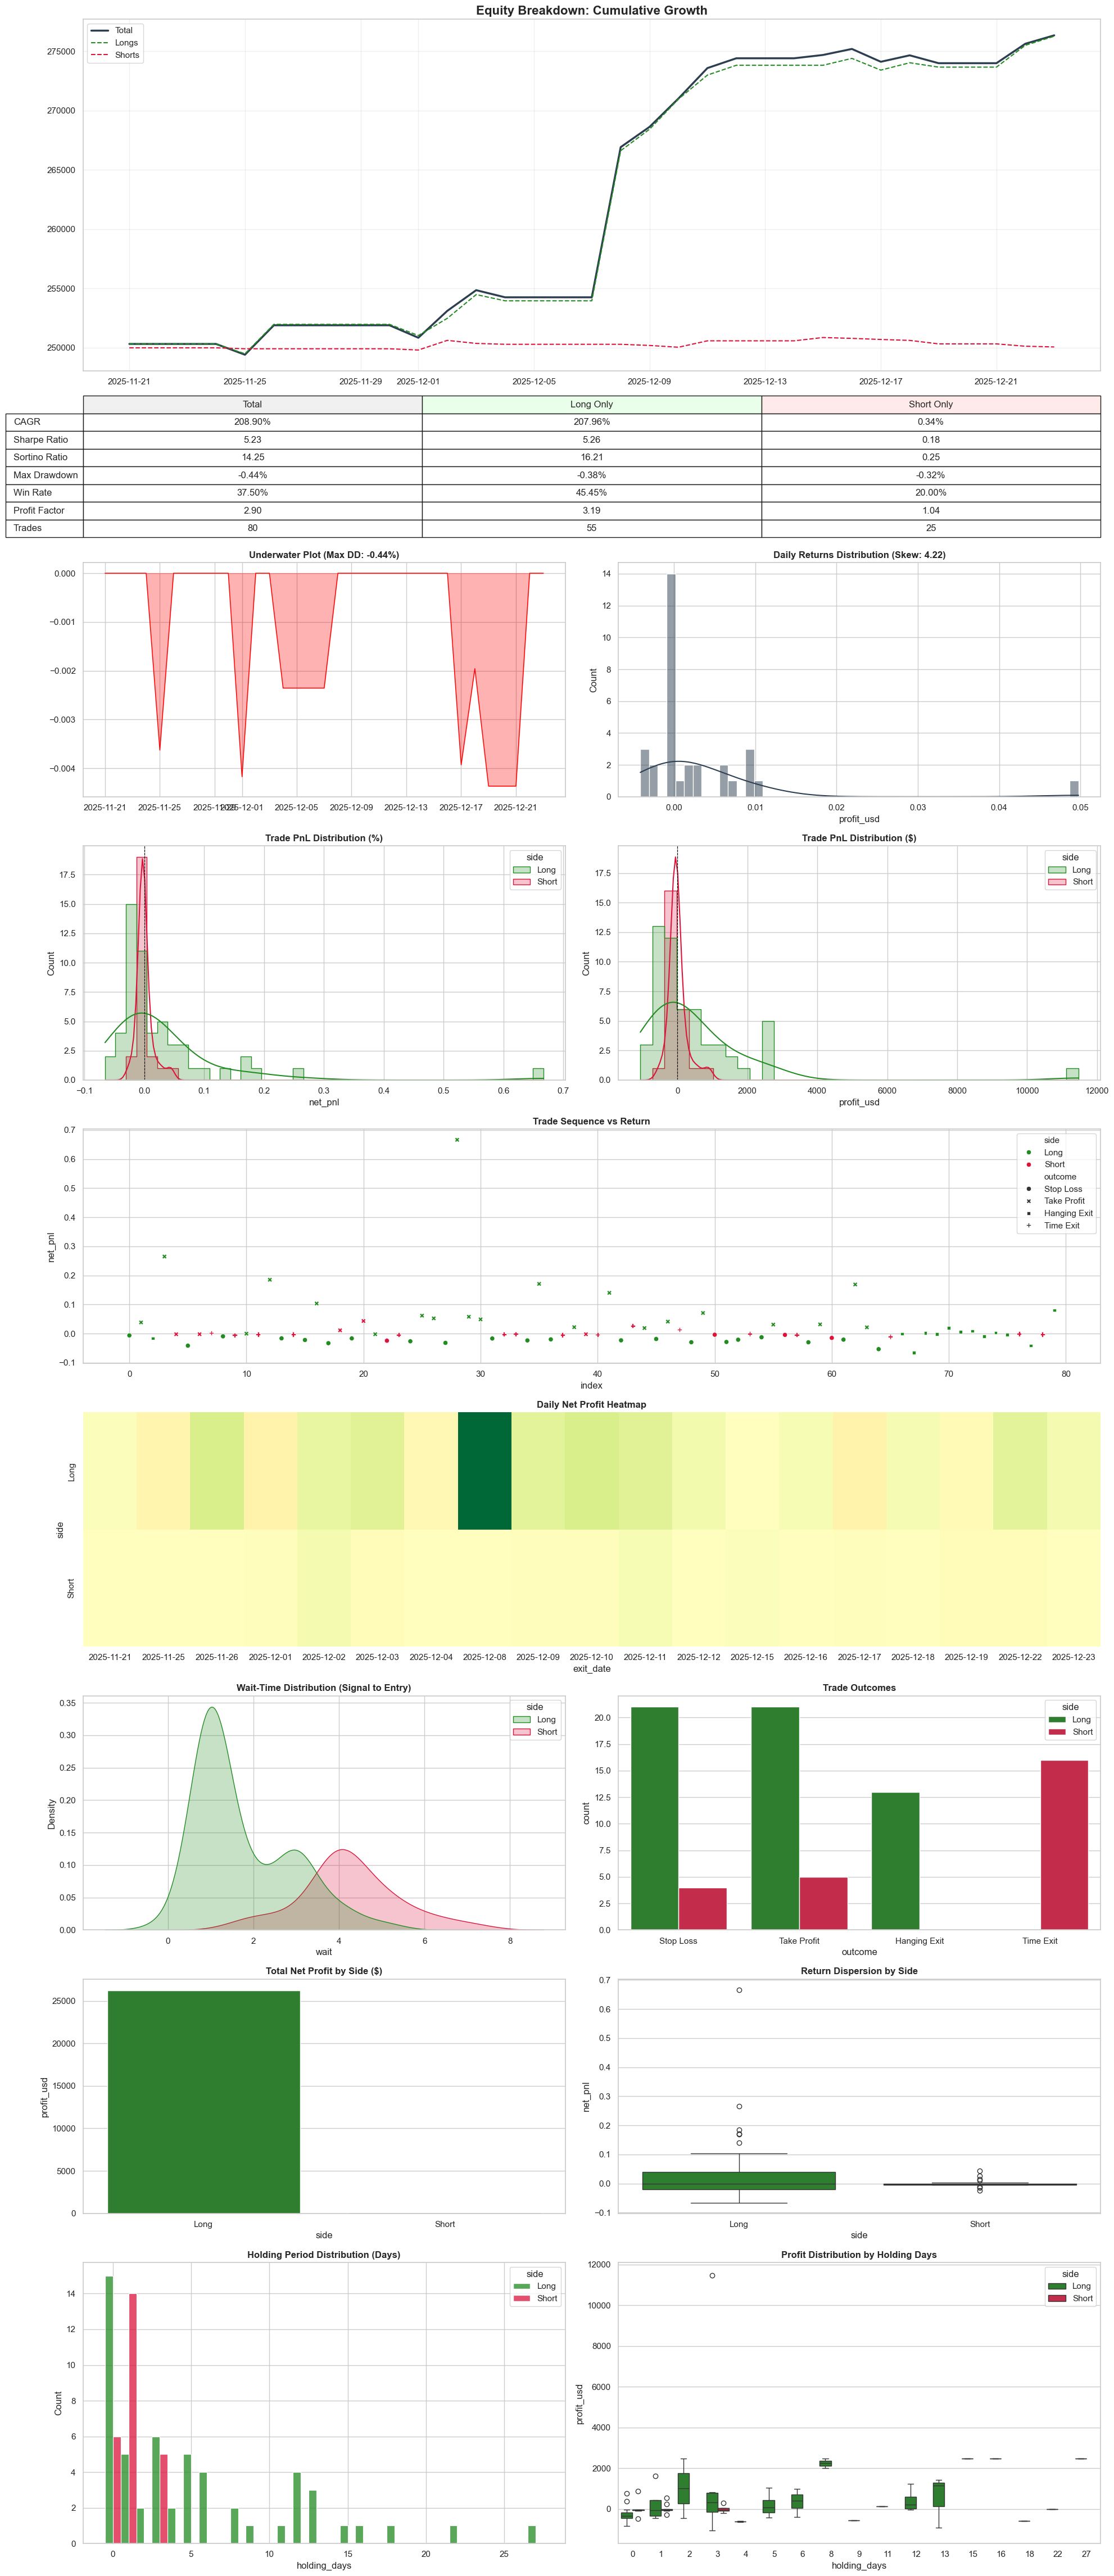
Tier 3: Balanced Growth ($20,000 Capital Cap)
| METRIC | TOTAL | LONG ONLY | SHORT ONLY |
|---|---|---|---|
| CAGR | 208.90% | 207.96% | 0.34% |
| Sharpe Ratio | 5.23 | 5.26 | 0.18 |
| Sortino Ratio | 14.25 | 16.21 | 0.25 |
| Max Drawdown | -0.44% | -0.38% | -0.32% |
| Total Return | 10.39% | 10.36% | 0.03% |
| Win Rate | 37.50% | 45.45% | 20.00% |
| Profit Factor | 2.90 | 3.19 | 1.04 |
| Avg Trade ($) | $329.30 | $477.63 | $2.96 |
| Trades | 80 | 55 | 25 |
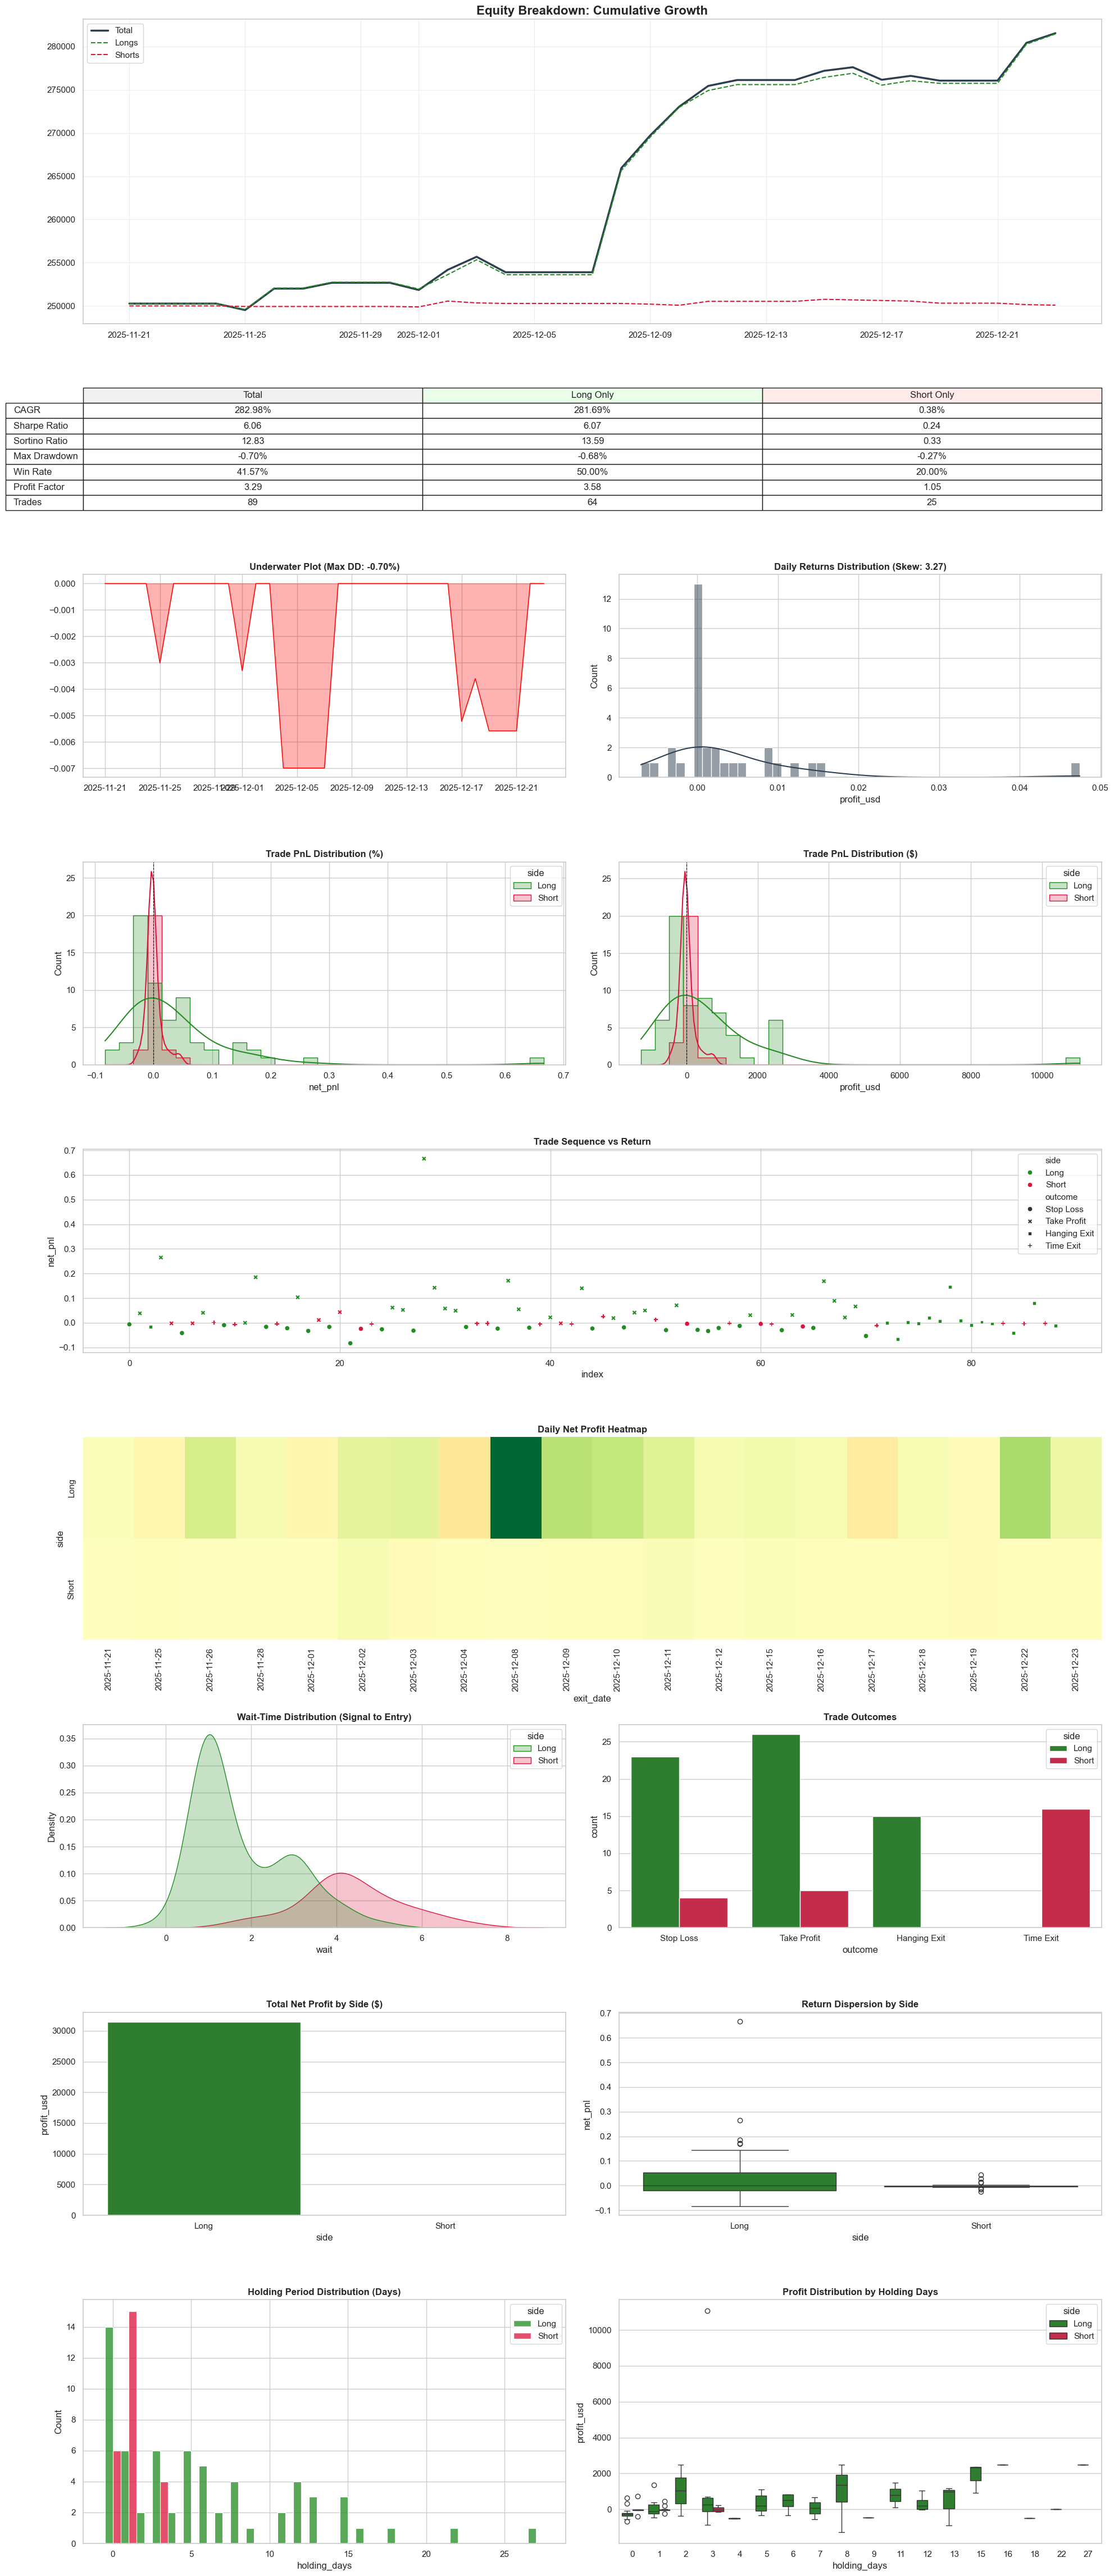
Tier 4: Peak Efficiency ($16,600 Capital Cap)
| METRIC | TOTAL | LONG ONLY | SHORT ONLY |
|---|---|---|---|
| CAGR | 282.98% | 281.69% | 0.38% |
| Sharpe Ratio | 6.06 | 6.07 | 0.24 |
| Sortino Ratio | 12.83 | 13.59 | 0.33 |
| Max Drawdown | -0.70% | -0.68% | -0.27% |
| Total Return | 12.49% | 12.46% | 0.03% |
| Win Rate | 41.57% | 50.00% | 20.00% |
| Profit Factor | 3.29 | 3.58 | 1.05 |
| Avg Trade ($) | $354.37 | $491.49 | $3.32 |
| Trades | 89 | 64 | 25 |
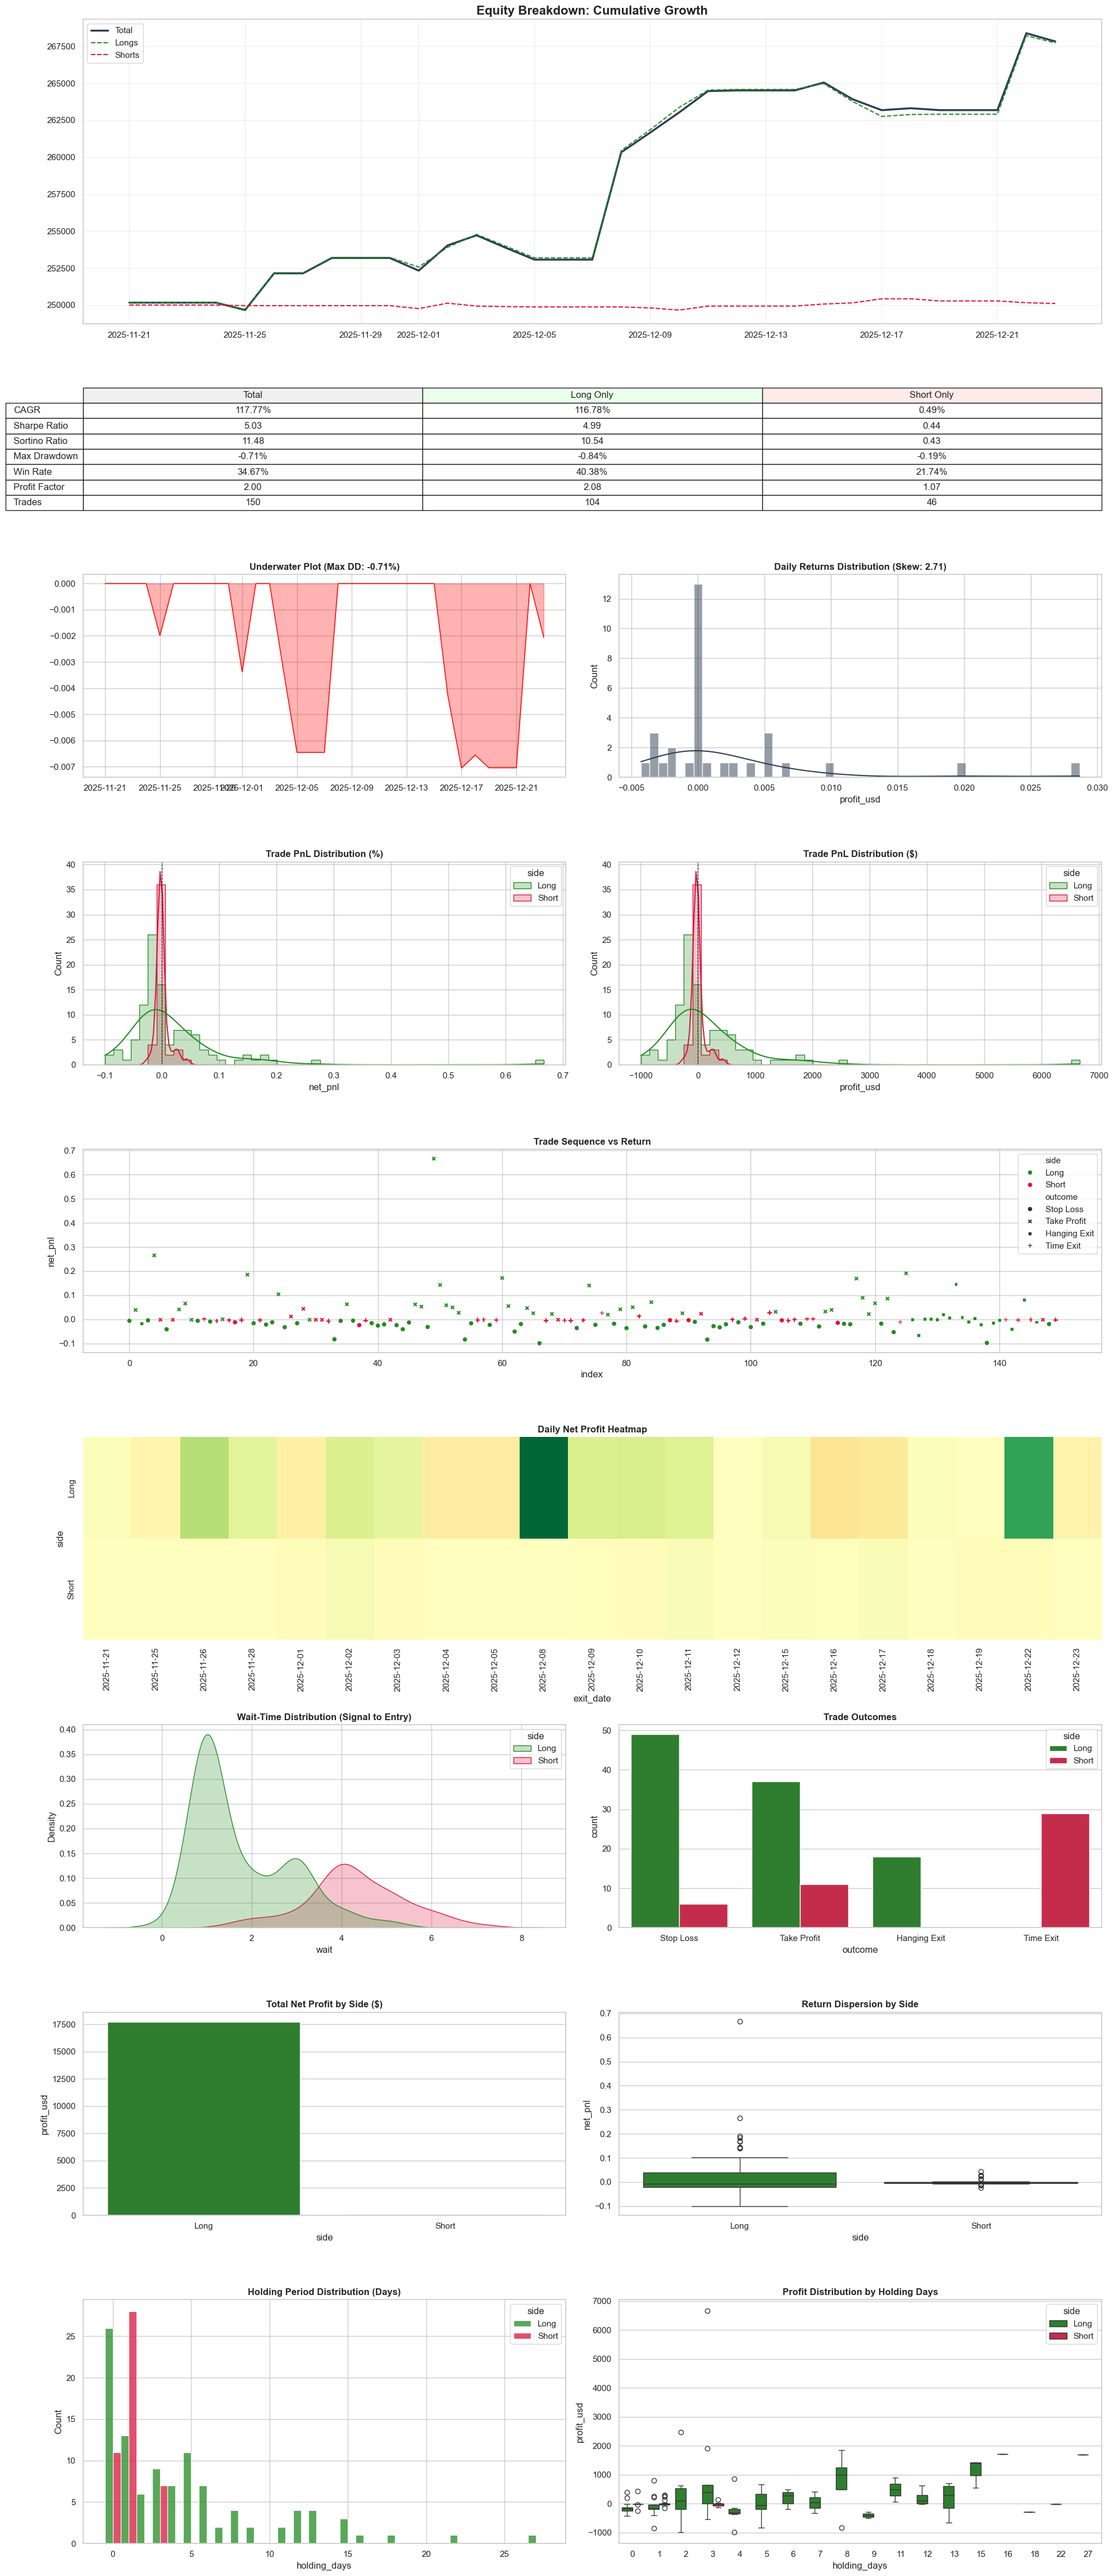
Tier 5: Diversified ($10,000 Capital Cap)
| METRIC | TOTAL | LONG ONLY | SHORT ONLY |
|---|---|---|---|
| CAGR | 117.77% | 116.78% | 0.49% |
| Sharpe Ratio | 5.03 | 4.99 | 0.44 |
| Sortino Ratio | 11.48 | 10.54 | 0.43 |
| Max Drawdown | -0.71% | -0.84% | -0.19% |
| Total Return | 7.06% | 7.02% | 0.04% |
| Win Rate | 34.67% | 40.38% | 21.74% |
| Profit Factor | 2.00 | 2.08 | 1.07 |
| Avg Trade ($) | $118.86 | $170.40 | $2.33 |
| Trades | 150 | 104 | 46 |
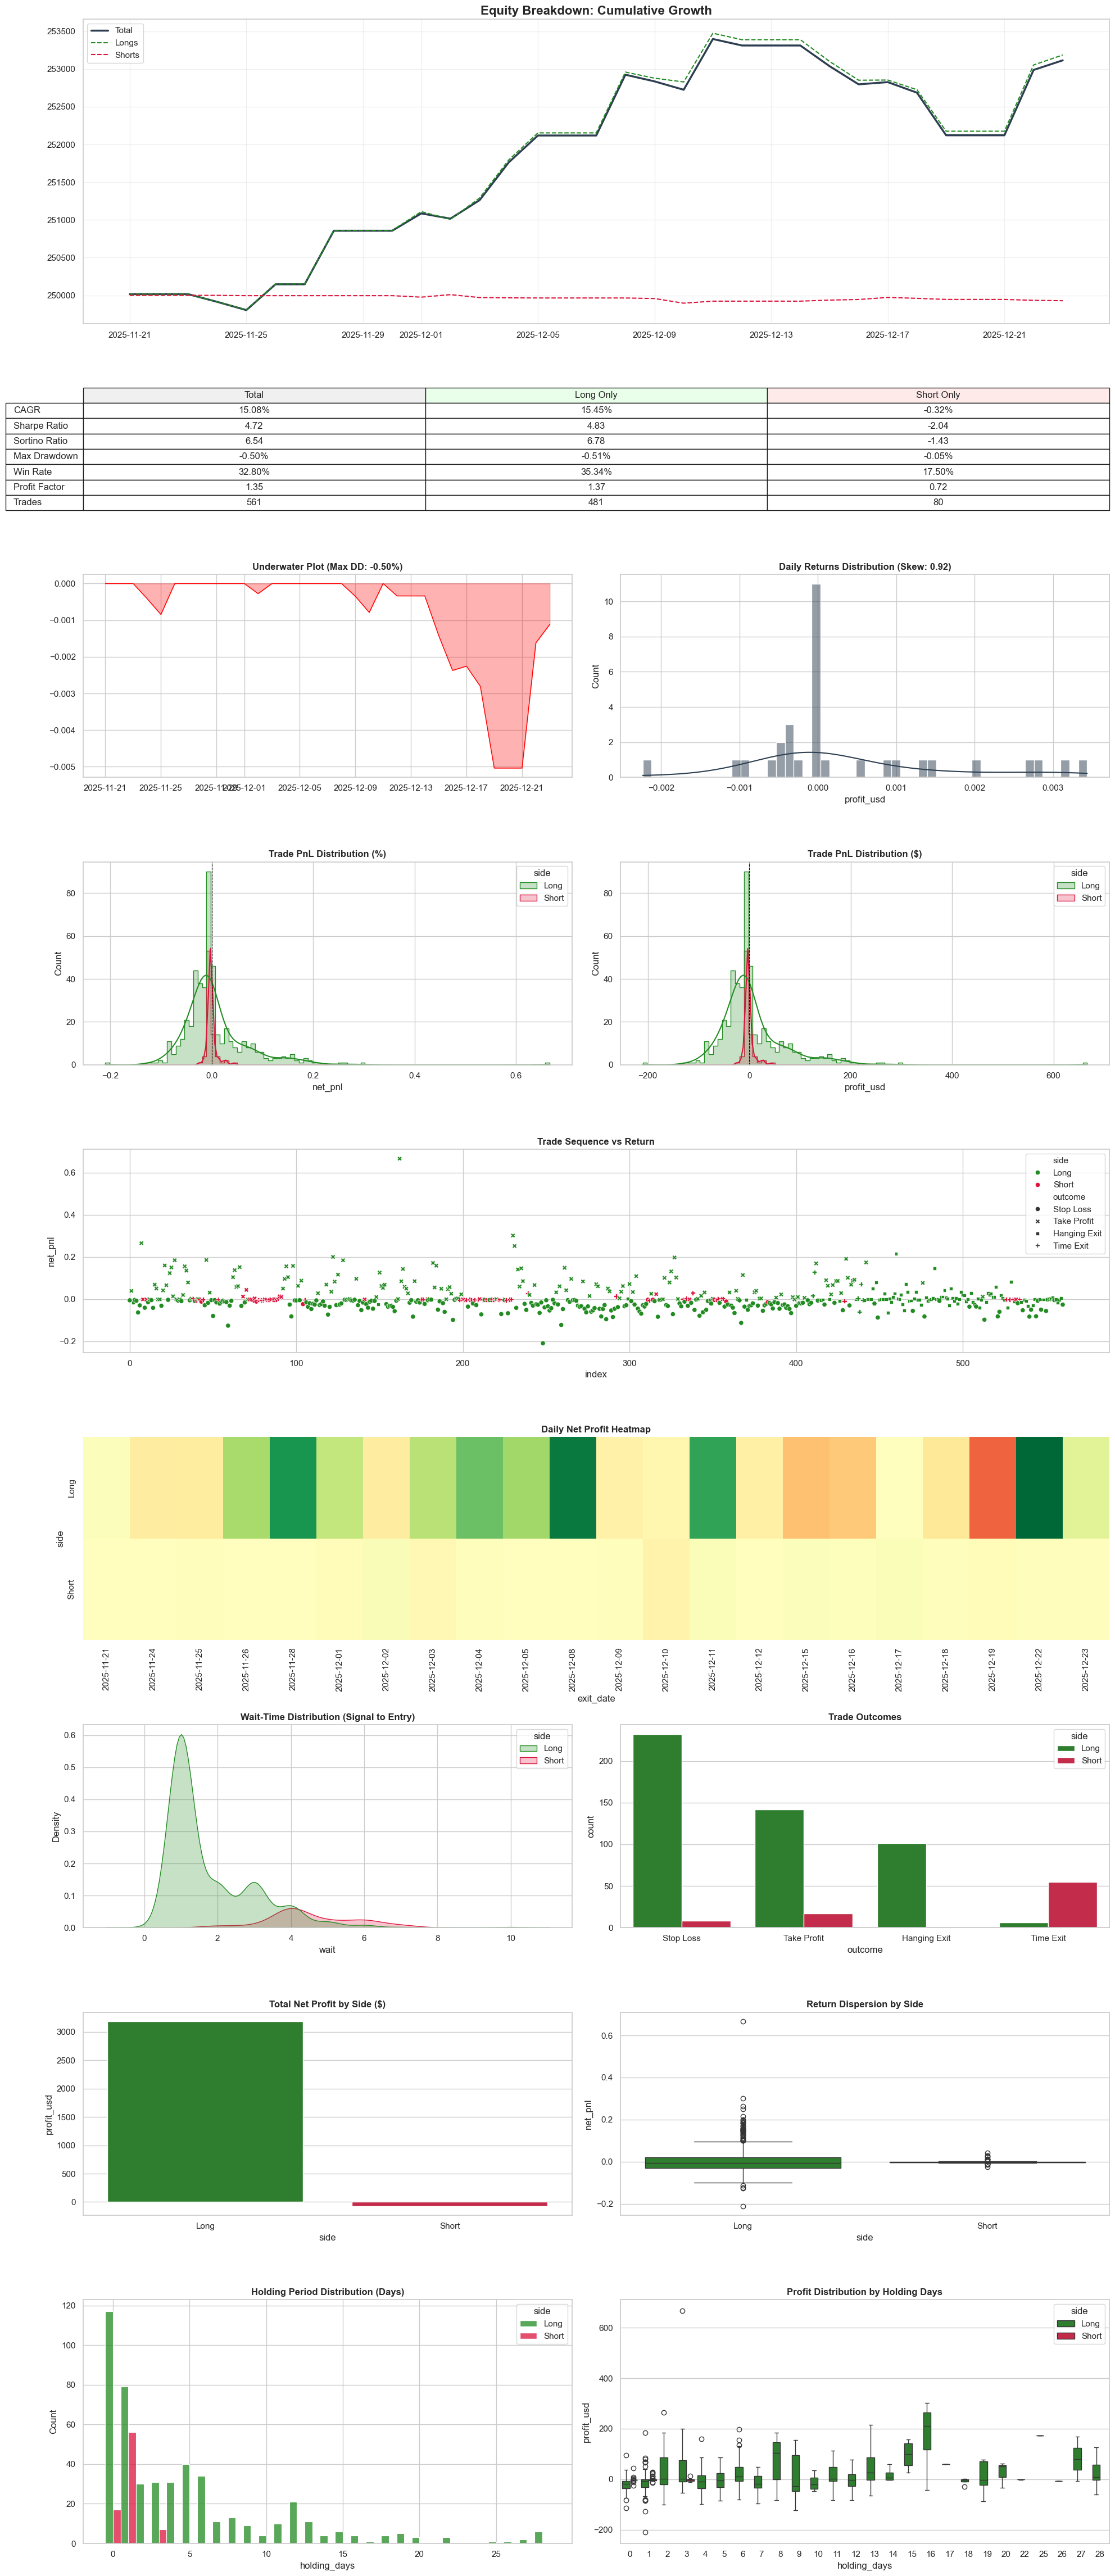
Unlimited: The Grind ($1,000 Capital Cap)
| METRIC | TOTAL | LONG ONLY | SHORT ONLY |
|---|---|---|---|
| CAGR | 15.08% | 15.45% | -0.32% |
| Sharpe Ratio | 4.72 | 4.83 | -2.04 |
| Sortino Ratio | 6.54 | 6.78 | -1.43 |
| Max Drawdown | -0.50% | -0.51% | -0.05% |
| Total Return | 1.24% | 1.27% | -0.03% |
| Win Rate | 32.80% | 35.34% | 17.50% |
| Profit Factor | 1.35 | 1.37 | 0.72 |
| Avg Trade ($) | $5.55 | $6.62 | -$0.89 |
| Trades | 561 | 481 | 80 |
The Bottom Line: Selection is the Force Multiplier
In the hunt for alpha, selection is everything. By focusing on the top energy signals and avoiding the “Unlimited” grind, you let the algorithm do the heavy lifting. Whether you are a “Sniper” looking for one great move or an “Optimal Performer” looking to maximize compounding, our framework provides the data and the discipline to trade with professional-grade efficiency.
Explore the data and start your journey at retailtrader.ai.