The Difference Between Tracking the Market and Beating It: A 6-Month Update
I posted a snapshot of my portfolio performance 60 days ago. Since then, the market (Orange line) has ticked up steadily. But my personal portfolio utilizing retailtrader.ai signals (Purple line) has widened the gap significantly.
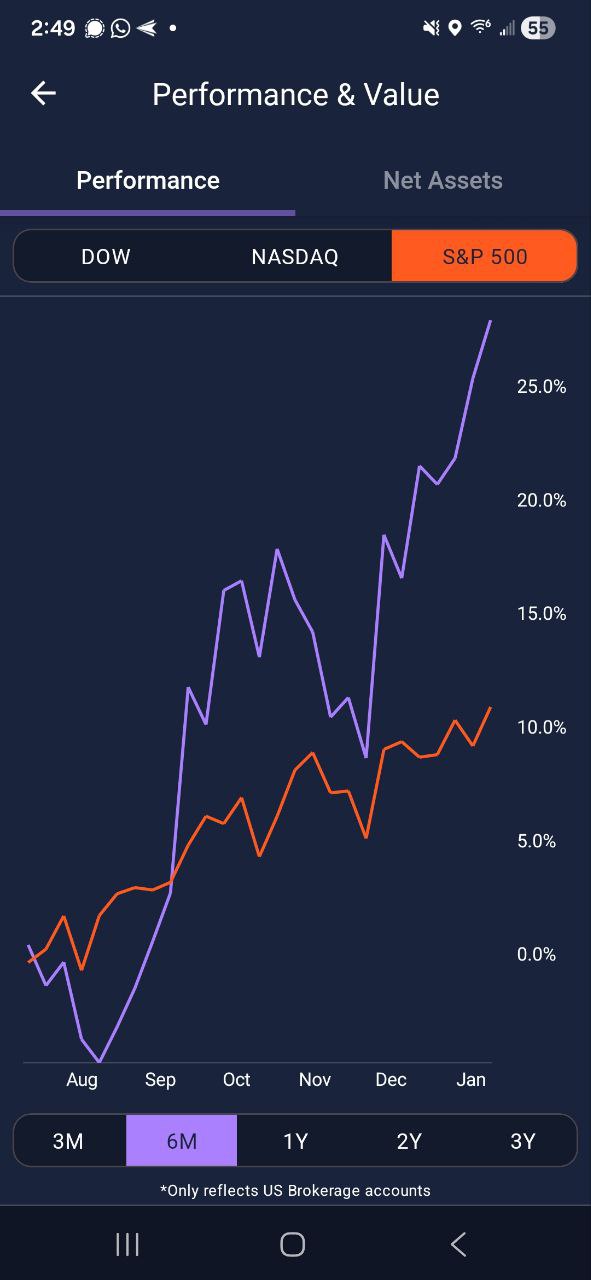 Figure 1: Performance comparison showing S&P 500 vs. My Portfolio over the last 6 months.
We are now looking at a +27% return over the last 6 months, compared to the market’s ~11%.
Why am I sharing this update?
Because there is a misconception that you need a hedge fund budget to get hedge fund results.
I am generating this alpha using two things:
- Our basic $34.99/month subscription.
- Strict discipline to execute on the signals provided.
The “discipline” part is key. You can see the volatility in the chart—especially back in August. The signals provide the roadmap, but you have to be the one to drive the car.
Tools don’t replace the trader—they empower them. This chart is what happens when you combine institutional-grade data with the consistency to see it through.
Disclaimer
Note from the CEO: I am the CEO of retailtrader.ai. The performance data shown above represents my personal US brokerage account and is for illustrative purposes only. Past performance—including the update shown here—is not indicative of future results. Trading in financial markets involves a high degree of risk and may not be suitable for all investors. This post does not constitute financial advice or a recommendation to buy or sell any securities. Individual results will vary based on market conditions, timing of trades, and individual discipline.